

In the first article in this series, we looked at the lactate step test and how it can be used to create an individual lactate profile. The step test is incredibly useful, particularly when repeated throughout the season. However, a step test only gives a snapshot and an estimate of your aerobic (LT1) and anaerobic (LT2) thresholds. In this newsletter, we describe how you can identify LT1 and LT2 more precisely in training.
The goal is not only to find a threshold number. The goal is to understand how lactate responds during training, and to use that information to better control intensity over time.
The warm-up
A practical cycling example is a 20-minute warm-up divided into three progressive parts:
- 7 minutes: easy
- 5 minutes: zone 2, moderate aerobic
- 4 minutes: zone 3, just below your estimated LT2
- 4 minutes: easy
Measure lactate before the warm-up and again after the warm-up, just before the first interval starts. As with the step test, post-warm-up lactate should ideally be equal to or lower than pre-warm-up lactate. In many cases, lactate will continue to fall during the first part of the session if the opening intervals are easy enough.
For running you may want to shorten the warmup slightly depending on your physical level. For beginners we recommend 10 minutes of slight progressive intensity followed by 3-4 minutes walking or easy pedaling.
Session 1: finding LT1
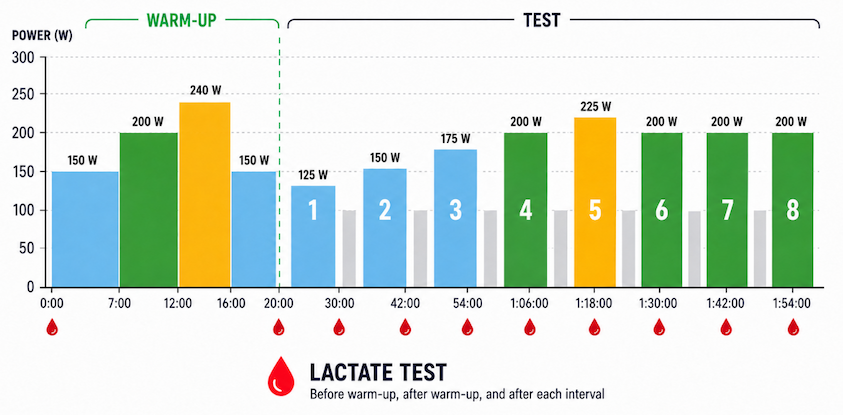
Figure 1: An example of a 8 x 10 minute LT1 session for a cyclist with an FTP/LT2 around 250W.
The structure
As seen in figure 1, 8 × 10 minutes, with 1–2 minutes recovery and a lactate test between intervals.
In practice, the interval duration can vary:
- for cycling, step lengths can range from 10 to 20 minutes
- for running, 8–10 minutes may often be enough
- for swimming, interval length in meters should be adapted to the athlete’s level.
How to progress the intensity
Start very low. The first intervals should be easy enough that lactate stays flat or even continues to fall.
As a practical starting point, increase by:
- around 10% of FTP in cycling
- 1–1.5 km/h in running around
- 2–3 seconds per 100 m in swimming
The aim is to pass LT1 at around interval 5. Once you do that, return to the estimated LT1 load and hold that load steady for the final intervals.
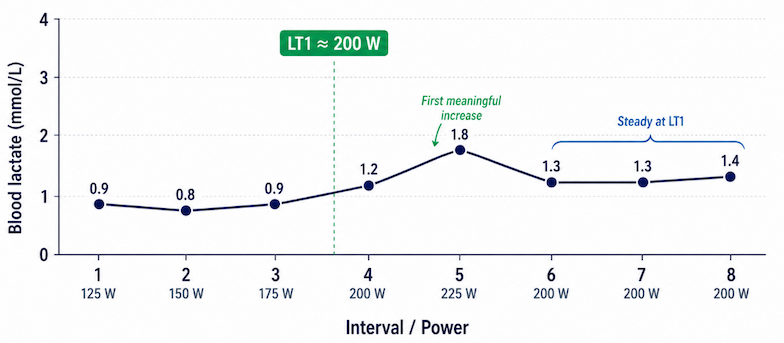
Figure 2: Example of a typical lactate response during the LT1 session.
What to look for
In figure 2, we show an example of what a typical lactate response looks like for this session. Measure lactate before the session starts, after the warm-up, and after every interval.
If the session starts correctly, lactate will often remain stable or drift slightly downward during the first intervals. At some point, lactate will begin to increase more clearly as the load increases. That first meaningful rise is the key signal.
For LT1, you are looking for the point where lactate first moves away from the stable baseline in a meaningful way. This is the first clear deflection point.
Once you find it, bring the load back to that level for the final intervals. If you have identified LT1 correctly, lactate should stay relatively stable there.
Practical takeaway
- stable or falling lactate early in the session
- the first meaningful rise as intensity increases
- stable lactate again when you return to the estimated LT1 load
Note: The lactate level from this session can be used as a reference for future sessions, with regular spot checks. Power or speed will change over time and can also change significantly with external factors such as climate, indoor versus outdoor conditions, altitude, and more.
Session 2: finding LT2
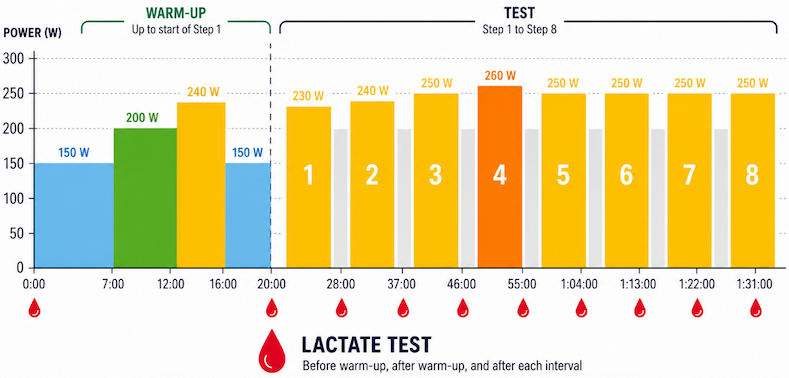
Figure 3: An example of an 8 × 8 minute session for a cyclist with LT2/FTP around 250 W.
The structure
For this session, we use slightly shorter intervals than for LT1. A practical range is 6 to 10 minutes per interval. For cycling, you can go as long as 10 × 10 minutes. For running, the session may be as short as 6 × 6 minutes. The exact format depends on the athlete, the sport, and how much precision you want.
A practical example for cycling is as seen in figure 3: 8 × 8 minutes, with 1 minute recovery and a lactate test between intervals.
How to start and progress
The goal is to approach LT2 more carefully, so the increases between intervals should be smaller than in the LT1 session.
- As a practical starting point: begin around 15% below estimated LT2 in cycling
- about 2 km/h below estimated LT2 pace in running
- around 6 seconds per 100 m slower than estimated LT2 pace in swimming
- around 4-6% in cycling
- 0.5–1.0 km/h in running
- around 2 seconds per 100 m in swimming
The aim is to pass LT2 around interval 4. After that, return to your estimated LT2 load and continue steadily for the remaining intervals.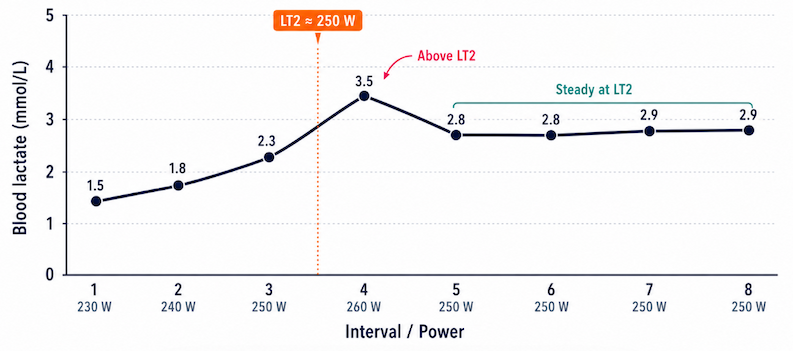
Figure 4: An example of a typical lactate response for a cyclist with FTP/LT2 around 250W.
What to look for
In figure 4, we now show a typical lactate response for the LT2 session. Measure lactate exactly as in the LT1 session, before the session starts, after the warm-up, and after every interval.
This time, you are not looking for the first small rise. You are looking for the point where lactate shifts into a much steeper response.
Below LT2, lactate should rise only gradually with increasing load. Once you move above LT2, the increase becomes much larger and the pattern changes from a more linear response to a clearly steeper and less stable one.
After you pass LT2, return to your estimated LT2 load and hold it steady. If your estimate is correct, lactate should stabilize at that level rather than continuing to rise sharply.
In the example in figure 4, lactate rises gradually through 230–250 W, then jumps clearly at 260 W, suggesting the athlete has moved above LT2. When the load is brought back to 250 W, lactate stabilizes. That suggests LT2 is around 250 W.
Practical takeaway
- a modest and controlled rise below LT2
- a clearly larger jump once you move above LT2
- stabilization again when you return to the estimated LT2 load

LT1 vs LT2 in training
These two sessions look similar on paper, but the interpretation is very different.
In the LT1 session, you are looking for the first meaningful rise in lactate above baseline.
In the LT2 session, you are looking for the point where lactate rises much more sharply and steady state is no longer maintained if the load is just a little too high.
That is why the LT1 session uses larger steps and longer intervals to make the first rise easier to see, while the LT2 session uses smaller increases to improve precision around the threshold.
Common mistakes
Increasing to aggressively: Large increases can make it harder to identify exactly where LT1 or LT2 occurs.
Inconsistent sampling: Poor blood flow, sweat contamination, variable timing, or poor handling can affect the result.
Looking at single values instead of trends: A single lactate reading is rarely the answer. The shape of the curve matters more. That is the key of these sessions.

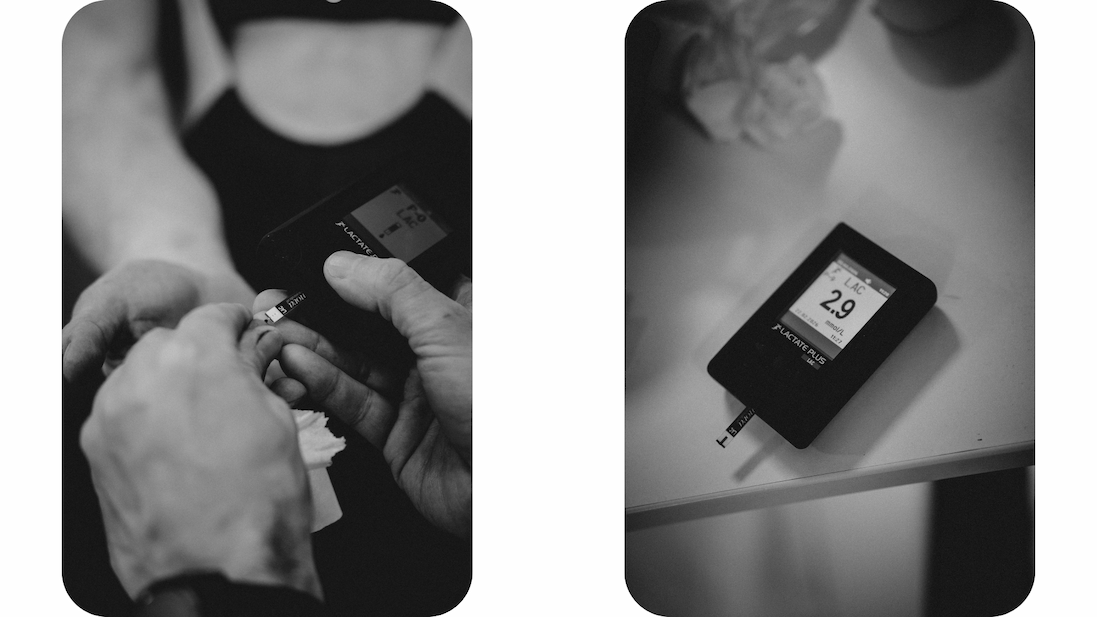
The tools are just as important as the framework. Reliable and reproducable measurements is key for consistency in testing. That is why we landed on the Lactate Plus which for us has shown to be exceptionally reliable in lab and in field.
Final thoughts
The sessions used as examples here are quite long and are therefore best suited for experienced endurance athletes. For beginners you want to make sure you hold to the same principles of the test, but reduce the step length and number of steps enough to make the total load of the session manageable. A good guideline is to keep the total volume similar or not more than 10% longer than similar sessions you are used to.
Used well, these sessions help turn lactate testing from a one-off test into a practical tool for daily training decisions.
Thank you for reading. If this topic interests you or you have follow up questions, leave a comment below or send us an email.